-
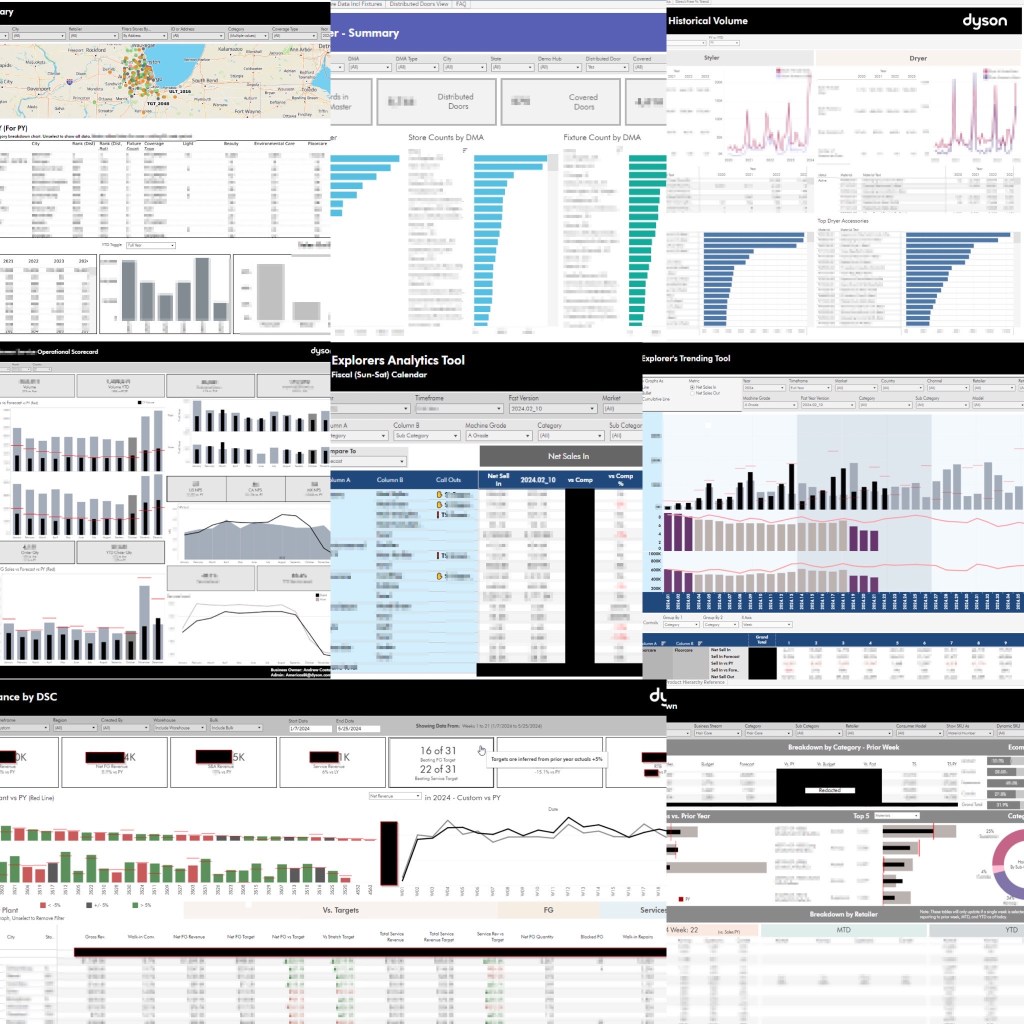
Study: A First Rate Category Tool
Site management doesn’t have to be a linearly scaled challenge! Visualizing data across custom groupings across states, DMAs, countries, and role can help with the quick identification of gaps and opportunities. A dashboard like this can be aligned to the top of the funnel of a PnL, while also providing flexibility for analysts and managers…
-
Study: A First Rate Category Tool
In the ever-evolving world, the art of forging genuine connections remains timeless. Whether it’s with colleagues, clients, or partners, establishing a genuine rapport paves the way for collaborative success.

-
Study: A First Rate Category Tool
Challenges in business are a given, but it’s our response to them that defines our trajectory. Looking beyond the immediate obstacle, there lies a realm of opportunity and learning.

-
Study: A First Rate Category Tool
Every business has a unique potential waiting to be tapped. Recognizing the keys to unlock this growth can set an enterprise on the path to unprecedented success.

My name is John DeLizza and have been professionally working with data for over eighth years! I am currently a Senior Business Intelligence and Reporting Analyst for Dyson America on the Strategy, Data Science, and Analytics team under Finance. My primary tools are Tableau, SQL, R, Python, and when all else fails, Excel.
I have worked with data since 2009 when I got an internship at a local medical device consulting company in Los Altos, CA. This company, First Light Health, consulted major healthcare brands such as Abbott, Samsung Health, and several local startups. on market strategy and product development. My tasks were simple – gather or input marketing survey data, perform basic analysis, and present findings.
This two-summer opportunity led me towards studying Statistics at Loyola University Chicago and another internship at Inspirotec, a local Chicago medical device startup. Here, I had my first foray into statistical analysis in a professional setting and provided a product pricing recommendation based on the Van Westerndorp pricing model built on survey data. I went on to graduate with a degree in statistics in 2016.
In the years since, I’ve had the privilege to work at CareerBuilder, Empire Today (1-800-588-2300), and Dyson. Ultimately, my work evolved from performing business analytics to business intelligence as I found great joy in automating reporting and never shied away from a challenge. This has led me to develop skills in VBA to automate Excel, R to serve as middleware for crude ETLs, SQL to speak to databases, and ultimately Python to serve as middleware for slightly less crude ETLs. Standing on top of it all is Tableau, which optimally delivers the only the most vital information from these foundations in an optimal way designed for each end user. This portfolio is a compilation of those highest level outputs. Absent from it is the thousands of lines of SQL, R, and Python code that has enabled it.
Thank you for your time.
John DeLizza
